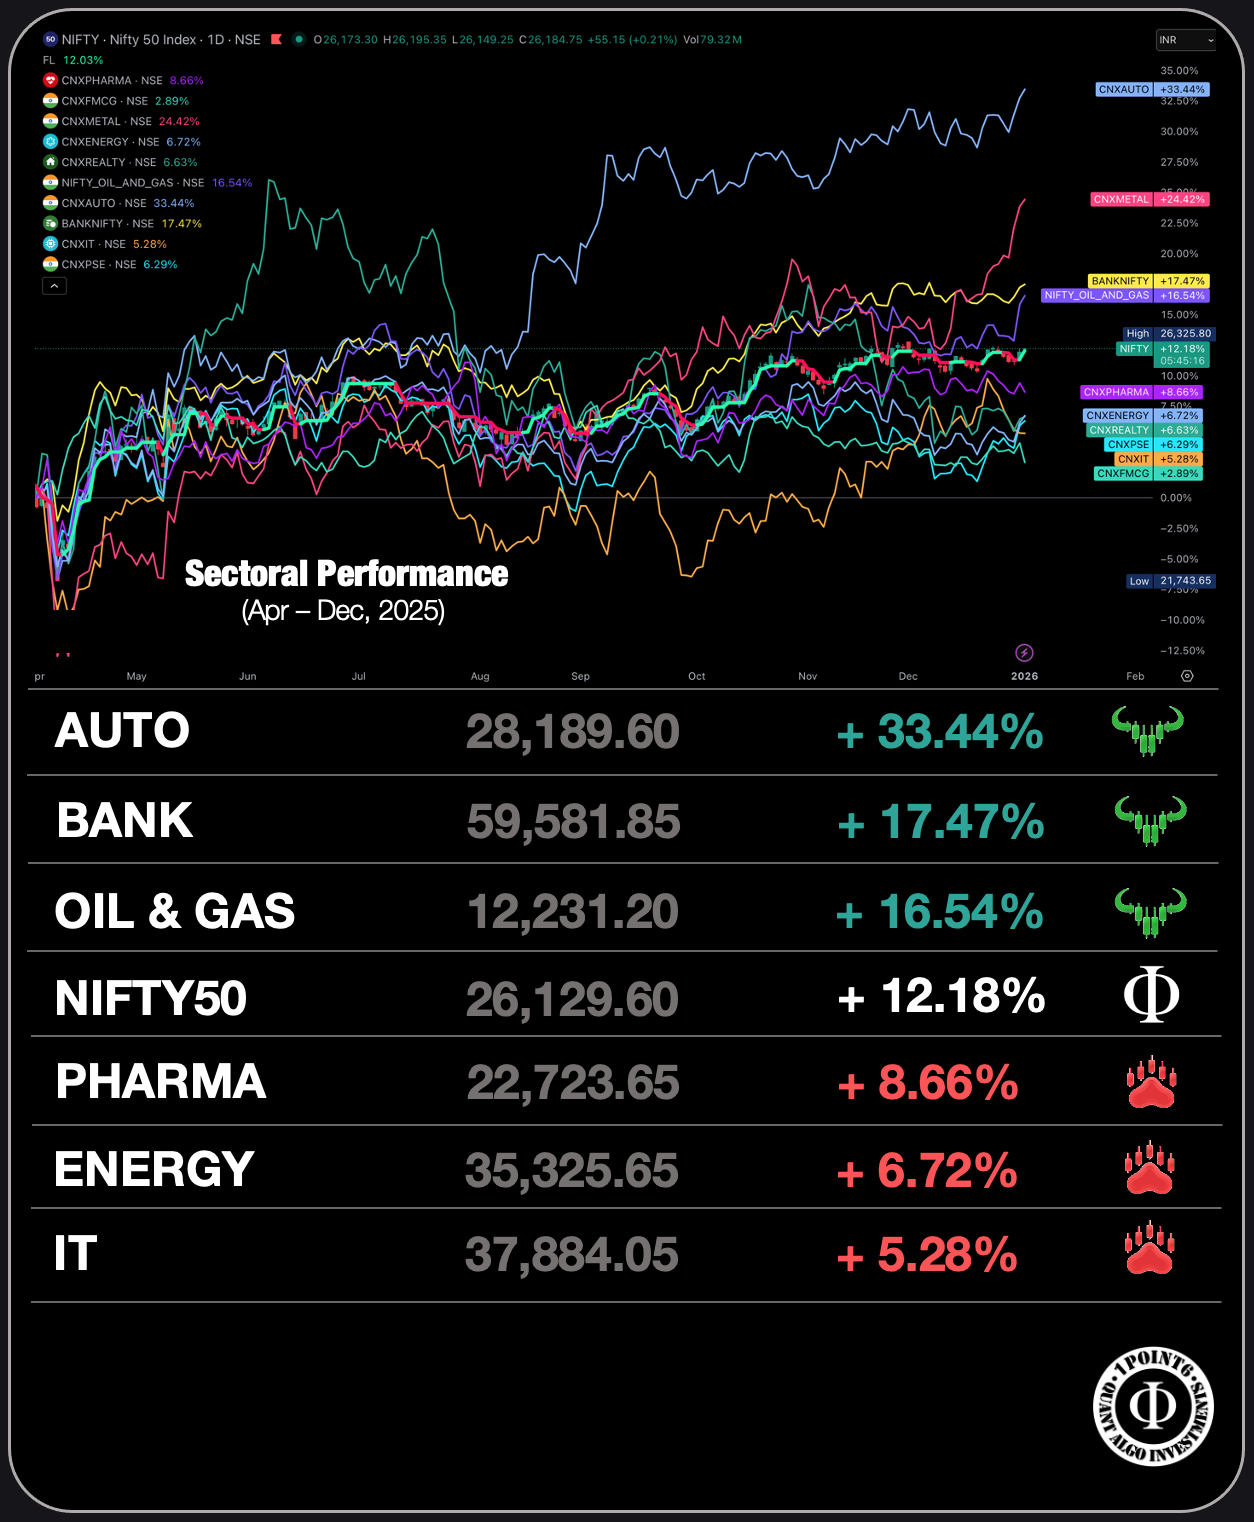
Top Performing Sectors — Comparative Report (Apr → Dec 2025)
Benchmark: NIFTY50 (26,129.60 | +12.18%)
1. Executive Summary
Between 01 April 2025 and the present, Indian equity markets have witnessed a clear divergence in sectoral performance. While the NIFTY 50 Index delivered a respectable +12.18% return, several sectors significantly outperformed the benchmark, highlighting strong rotational leadership and differentiated earnings visibility.
The market environment during this period favored cyclical, consumption-linked, and balance-sheet–strong sectors, while defensives and export-oriented segments underperformed. This divergence offers important insights into institutional positioning, risk appetite, and future sector leadership.
2. Benchmark Overview: NIFTY 50
- Return (Apr 2025 – Now): +12.18%
- Trend characterized by:
- Controlled volatility
- Higher-high, higher-low structure
- Sectoral rotation rather than broad-based uniform rallies
The NIFTY 50 acted as a stable anchor, while alpha was generated primarily through sector selection, not index-level exposure alone.
3. Sector-wise Performance Comparison
3.1 Auto Sector — Clear Leader
Performance: +33.44% | Strong Outperformance vs NIFTY
Key Observations
- Persistent relative strength throughout the period
- Shallow drawdowns during market corrections
- Strong momentum expansion from mid-year onward
Key Drivers
- Sustained domestic demand
- Margin expansion via operating leverage
- EV adoption narrative supporting re-rating
- Strong balance sheets and pricing power
Interpretation
The Auto sector emerged as the primary leadership group, reflecting both cyclical tailwinds and structural growth visibility. Institutional capital consistently rotated into Auto during market consolidations.
Outlook
- Bias remains structurally bullish
- Any corrective phases are likely to be accumulative rather than distributive
3.2 Banking & Financials — Structural Support
Performance: +17.47% | Moderate Outperformance
Key Observations
- Steady trend with lower volatility
- Outperformed the index but lagged high-beta sectors
- Acted as a stabilizer during volatile phases
Key Drivers
- Credit growth momentum
- Improved asset quality
- Stable net interest margins
- Strong capital adequacy
Interpretation
Banking provided structural depth to the rally, though not speculative upside. Institutions maintained exposure for portfolio stability rather than momentum chasing.
Outlook
- Continues as a core portfolio sector
- Likely to deliver steady, compounding returns rather than sharp rallies
3.3 Oil & Gas — Cyclical Strength
Performance: +16.54% | Outperformed NIFTY
Key Observations
- Strong upward slope with episodic volatility
- Benefited from global energy dynamics and refining margins
Key Drivers
- Stable demand outlook
- Improved profitability in downstream players
- Cash flow visibility supporting valuations
Interpretation
Oil & Gas acted as a cyclical hedge, attracting capital during inflation and commodity-sensitive phases.
Outlook
- Trend remains positive but sensitive to global cues
- Best suited for tactical allocations rather than aggressive overweighting
3.4 NIFTY 50 — Market Average
Performance: +12.18%
The benchmark’s return reflects rotational participation rather than broad-based sectoral strength, reinforcing the importance of sector selection for alpha generation.
3.5 Pharma — Defensive Underperformance
Performance: +8.66% | Underperformed NIFTY
Key Observations
- Choppy price structure
- Failed to sustain momentum breakouts
- Lower participation during risk-on phases
Key Drivers
- Pricing pressure in key export markets
- Regulatory overhangs
- Shift in capital toward domestic cyclicals
Interpretation
Pharma acted as a relative laggard, indicating reduced demand for defensives during this period.
Outlook
- Neutral to mildly positive
- Requires fresh triggers for leadership re-emergence
3.6 Energy — Subdued Participation
Performance: +6.72% | Clear Underperformance
Key Observations
- Range-bound behavior
- Limited follow-through on rallies
Key Drivers
- Policy uncertainties
- Capital-intensive balance sheets
- Selective investor interest rather than broad accumulation
Interpretation
Energy lacked the momentum characteristics seen in leadership sectors and remained largely portfolio-neutral.
Outlook
- Stock-specific opportunities may exist
- Sector-wide leadership unlikely in the near term
3.7 Information Technology — Weakest Performer
Performance: +5.28% | Significant Underperformance
Key Observations
- Consistent relative weakness
- Failed to participate meaningfully in index upswings
Key Drivers
- Global tech spending slowdown
- Currency normalization
- Margin pressure and valuation compression
Interpretation
IT was a capital source sector, with funds rotating out toward domestic growth themes.
Outlook
- Structural base formation possible
- Leadership revival would require global demand revival
4. Relative Strength & Rotation Insights
- Clear Leaders: Auto, Banking, Oil & Gas
- Market Performers: NIFTY 50
- Laggards: Pharma, Energy, IT
The sectoral data highlights a classic mid-cycle market phase, where:
- Cyclicals and consumption lead
- Defensives lag
- Export-heavy sectors struggle
5. Forward-Looking Sector Outlook
High Conviction Zones
Neutral / Tactical Zones
Watchlist / Base-Building Zones
Future market performance is likely to remain rotation-driven rather than index-driven, rewarding disciplined sector allocation over passive exposure.
6. Conclusion
From 01 April 2025 to the present, Indian equity markets have delivered selective, sector-led returns. The NIFTY 50’s +12.18% gain masks a much wider dispersion beneath the surface.
The key takeaway for investors is clear:
Alpha during this phase was generated through sector selection, not market timing.
Unless macro conditions materially deteriorate, the market structure suggests continued leadership from domestic cyclical sectors, with defensives and export-oriented segments remaining secondary participants.