🇮🇳 INDIA SECTORAL PERFORMANCE ANALYSIS
Period: 01 April 2025 → 31 December 2025
1. Executive Summary
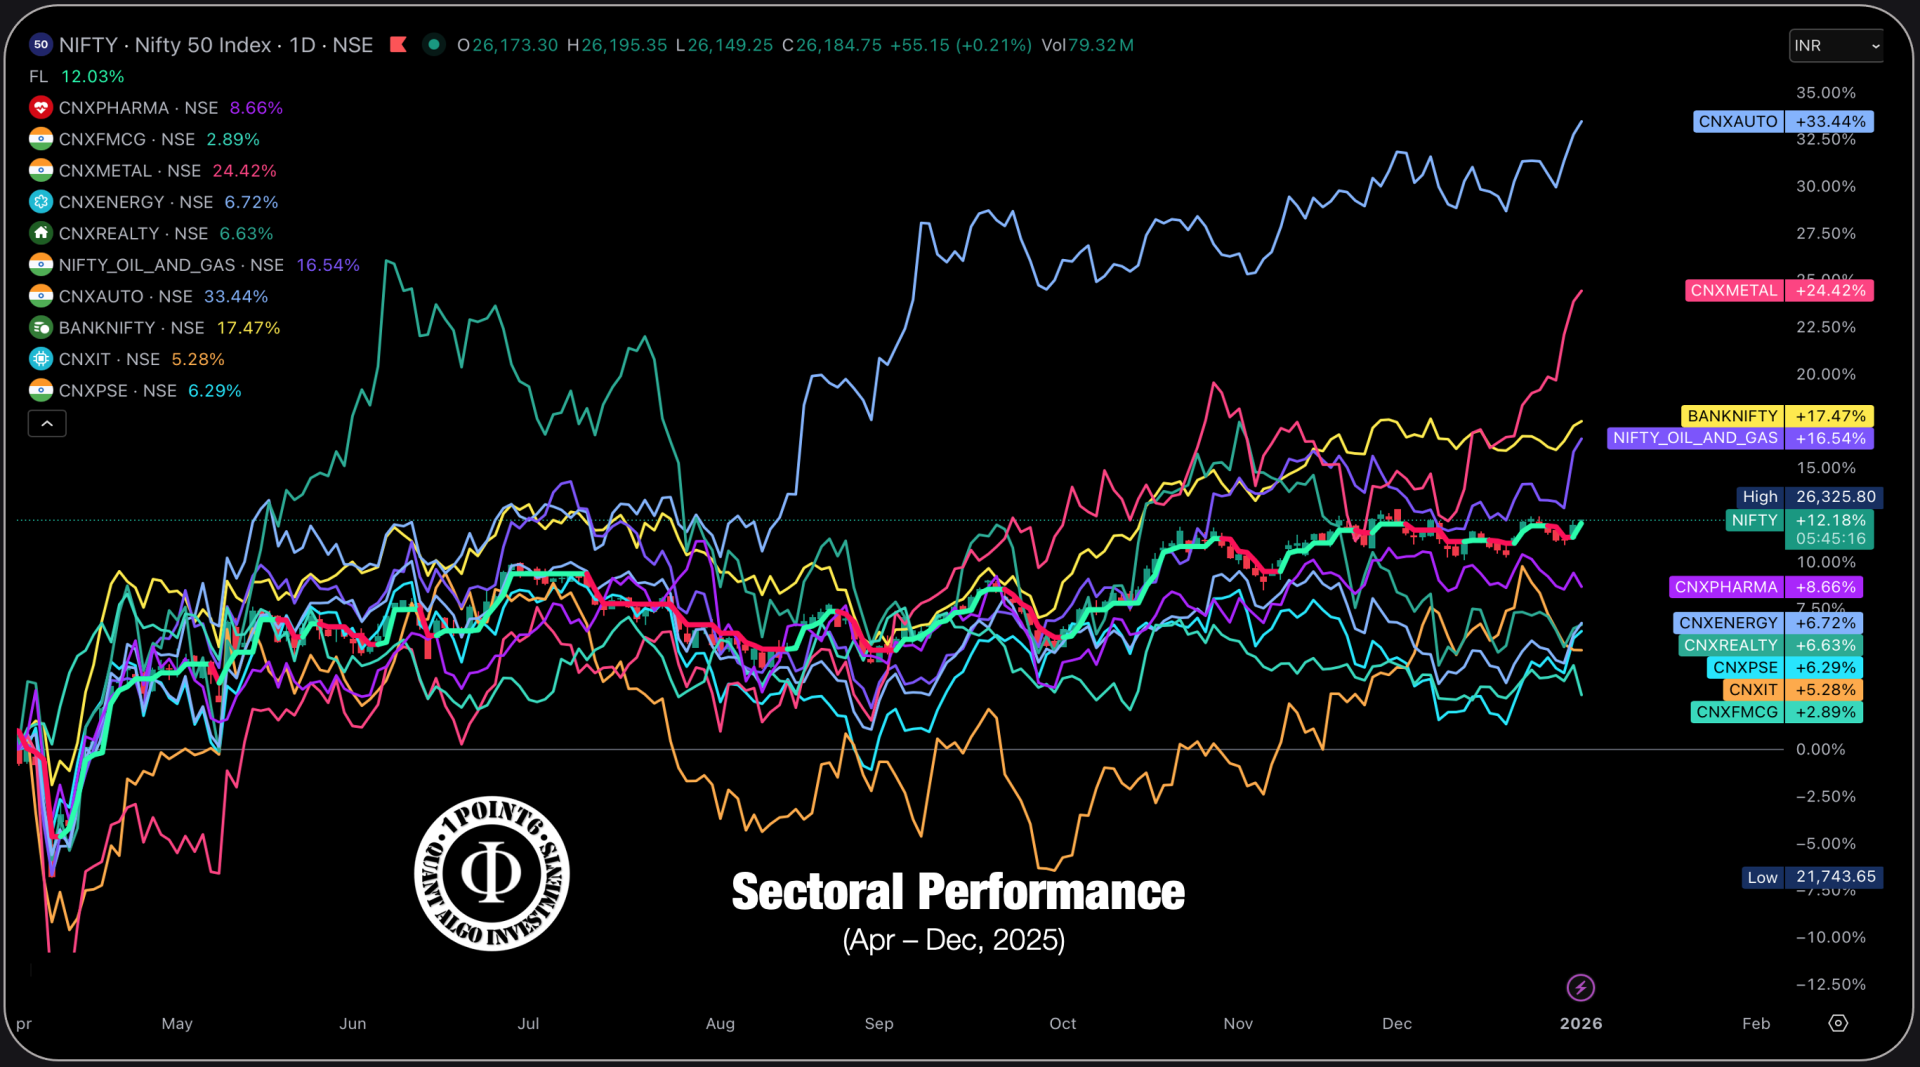
From 01 April 2025 to the present, Indian equity markets have displayed clear sectoral divergence, with leadership concentrated in select cyclical and domestic-demand-driven indices. While the benchmark NIFTY 50 delivered a +12.18% return, several sectors meaningfully outperformed, reflecting institutional rotation rather than broad-based market participation.
The period was characterised by:
- Strong domestic growth themes
- Preference for balance-sheet strength
- Gradual exit from export-dependent and defensive sectors
This report evaluates relative performance, structural drivers, policy influences, and future outlook for major Indian sectoral indices.
2. Benchmark Context: NIFTY 50
Performance: +12.18%
The benchmark index served as a stable anchor, moving in a controlled upward trajectory with phases of consolidation. Gains were largely driven by select heavyweight sectors, while many constituents remained range-bound.
Key Interpretation:
Index-level returns understated the opportunity set available through sector selection and rotation.
3. Sector-wise Detailed Analysis
3.1 Auto Index — Market Leader
Performance: +33.44%
Structural Observations
- Strong and sustained uptrend throughout the period
- Minimal drawdowns during broader market corrections
- Clear relative strength versus the benchmark
Key Drivers
- Robust domestic consumption
- Pricing power and operating leverage
- EV transition optimism
- Strong balance sheets and cash flows
Regulatory / Industry Factors
- Supportive policy environment for manufacturing
- Incentives for localisation and EV adoption
Outlook
- Structurally bullish
- Likely to remain a leadership sector, though near-term consolidation may occur after sharp gains
3.2 Metal Index — High Beta Cyclical Outperformance
Performance: +24.42%
Structural Observations
- Volatile but directional uptrend
- Sharp momentum acceleration post mid-year
Key Drivers
- Infrastructure-led demand
- Improved global commodity pricing
- Operating leverage in metal producers
Regulatory / Industry Factors
- Government infrastructure spending
- Environmental compliance costs (long-term risk)
Outlook
- Positive but cyclical
- Suitable for tactical exposure rather than permanent overweight
3.3 Banking Index — Structural Backbone
Performance: +17.47%
Structural Observations
- Steady, low-volatility uptrend
- Outperformed NIFTY but lagged high-beta sectors
Key Drivers
- Credit growth revival
- Improved asset quality
- Stable net interest margins
- Strong capital adequacy
Regulatory / Industry Factors
- Tight regulatory oversight
- Conservative provisioning norms (positive long-term)
Outlook
- Core portfolio sector
- Likely to compound steadily rather than deliver explosive returns
3.4 Oil & Gas Index — Cyclical Stability
Performance: +16.54%
Structural Observations
- Consistent upward bias with intermittent volatility
- Strong recovery phases aligned with commodity cycles
Key Drivers
- Refining margin stability
- Energy demand growth
- Cash-flow-rich business models
Regulatory / Industry Factors
- Price controls and policy interventions
- Energy transition pressures over the long term
Outlook
- Neutral-to-positive
- Best suited for tactical and income-oriented strategies
3.5 Pharma Index — Defensive Underperformance
Performance: +8.66%
Structural Observations
- Choppy price action
- Failed to sustain breakout momentum
Key Drivers
- Export market pricing pressure
- Regulatory scrutiny
- Reduced defensive demand during risk-on phases
Regulatory / Industry Factors
- Stringent global compliance norms
- High R&D and regulatory costs
Outlook
- Neutral
- Leadership revival requires earnings visibility and regulatory clarity
3.6 Energy Index — Subdued Participation
Performance: +6.72%
Structural Observations
- Range-bound structure
- Limited participation in broader market rallies
Key Drivers
- Capital-intensive balance sheets
- Policy uncertainty
- Selective investor interest
Regulatory / Industry Factors
- Transition to renewable energy
- Policy shifts affecting legacy assets
Outlook
- Stock-specific opportunities likely
- Sector-wide leadership unlikely in the near term
3.7 Information Technology Index — Lagging Sector
Performance: +5.28%
Structural Observations
- Persistent relative weakness
- Failed to participate meaningfully in index upmoves
Key Drivers
- Global tech spending slowdown
- Margin pressure
- Currency normalisation
Regulatory / Industry Factors
- Dependence on overseas demand
- Immigration and compliance regulations abroad
Outlook
- Base-building phase
- Structural recovery contingent on global demand revival
4. Relative Strength & Rotation Insights
Leaders:
Structural Supports:
Laggards:
This dispersion reflects a mid-cycle expansion phase, where capital favours domestic cyclicals and balance-sheet strength over defensives and export-dependent sectors.
5. Forward Sectoral Outlook (12–18 Months)
High Conviction
- Auto
- Select Banking & Financials
Tactical / Cyclical
Watchlist / Base Formation
6. Key Risks to Monitor
- Global growth slowdown impacting cyclicals
- Commodity price volatility
- Policy changes affecting regulated sectors
- External capital flow volatility
At present, these risks are manageable and not trend-altering.
7. Conclusion
Between 01 April 2025 and now, Indian equity markets have rewarded sectoral selection over index exposure. The data clearly indicates that:
Alpha generation during this phase was driven by rotation into domestic growth and cyclical sectors.
Unless there is a material macro or policy shock, this sector-led market structure is likely to persist, making disciplined allocation and rotation strategies critical for long-term investors.