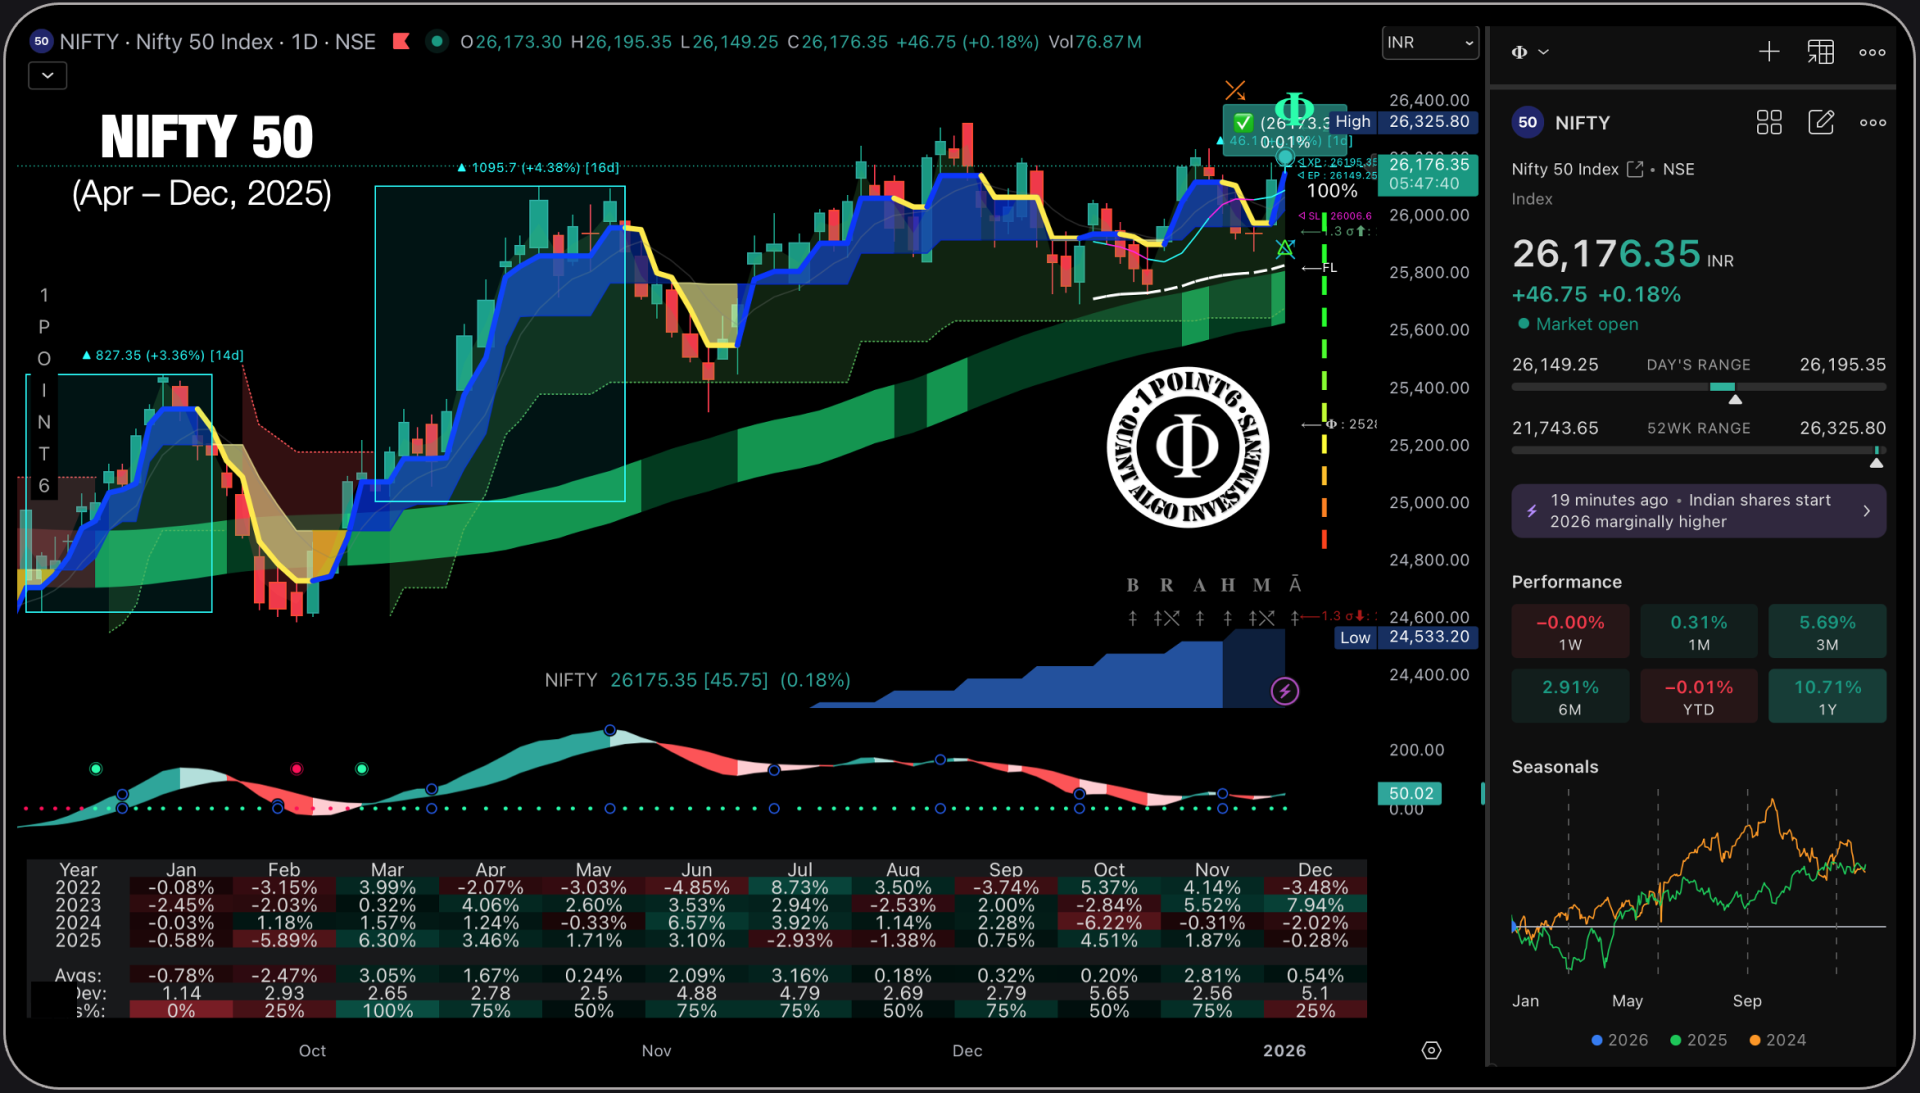
NIFTY 50 — Technical Outlook
Period Covered: 01 April 2025 → 31 December 2025
Trend Model: 1POINT6 BRAHMĀ + Absolute Band + SCALPER Line + Momentum Cloud Structures
Timeframe: 1D
Status: Market closed at 26,129.60 (+0.74%)
SUMMARY VIEW
Technical & Market Structure Analysis
Period: 01 April 2025 – Present | Outlook: Forward-Looking
1. Executive Summary
From April 2025 to present, NIFTY 50 has transitioned from a volatile corrective phase into a structurally strong, higher-high–higher-low trend. The index has respected its primary trend support, absorbed multiple pullbacks without structural damage, and is currently positioned near lifetime highs, reflecting institutional participation rather than speculative excess.
The current market phase is best described as a controlled bullish expansion with periodic mean reversion, not a euphoric blow-off. This significantly improves the risk-reward profile for trend-aligned investors.
2. Price Action & Trend Structure
2.1 Phase-wise Breakdown
Phase 1: April – Early June 2025 (Correction & Base Formation)
- Index underwent a controlled decline after Q1 excesses
- Volatility expanded temporarily but no long-term trend breakdown occurred
- Price stabilized above long-term demand zones, forming a structural base
Phase 2: Mid-June – August 2025 (Trend Re-acceleration)
- Strong impulsive move upward with wide bullish candles
- Pullbacks were shallow and time-based, indicating institutional absorption
- Breakout from consolidation confirmed trend reversal to bullish
Phase 3: September – October 2025 (Consolidation at Higher Levels)
- Sideways movement within a rising range
- Healthy digestion of gains; no aggressive distribution signatures
- Trend support continued to rise, compressing downside risk
Phase 4: November 2025 – Present (Expansion Near Highs)
- Price reclaimed momentum and pushed into new highs
- Volatility remains controlled, suggesting accumulation, not exhaustion
- Current candles show acceptance above prior resistance zones
3. Indicator & Quant Structure Interpretation (From Chart)
3.1 Primary Trend Engine (Green Structural Band)
- Acts as long-term institutional fair value
- Price has consistently respected this band since June 2025
- No sustained close below this zone → trend integrity intact
3.2 Momentum Regime Bands (Blue / Yellow Zones)
- Blue zones dominate the trend, indicating strong momentum cycles
- Yellow zones appear during pullbacks, not trend reversals
- Transitions have been clean and non-erratic, confirming signal reliability
3.3 Follow-Line / Dynamic Support
- Acts as active trailing support
- Price reactions from this line have repeatedly led to new highs
- Currently rising, which raises the floor for downside risk
3.4 Market Breadth & Internal Strength (Lower Panel)
- Oscillator cycles show higher momentum lows
- Momentum resets have occurred above the baseline, not below
- Indicates trend continuation with internal strength intact
4. Key Levels & Market Structure
Immediate Structure
- Resistance: Near recent all-time highs (26,300+ zone)
- Acceptance above this level opens the path for trend extension
Support Zones
- Primary support: 25,800 – 26,000 (trend + follow-line confluence)
- Secondary support: 25,200 – 25,400 (structural demand band)
- Only a decisive breakdown below secondary support would alter the bullish structure
5. Volatility & Risk Profile
- Volatility is compressing near highs, not expanding
- This is characteristic of institutional accumulation, not retail blow-off
- Pullbacks remain orderly and controlled, indicating a healthy market
Risk is currently asymmetric in favor of bulls as long as price remains above the rising structural band.
6. Forward Outlook
Base Case (High Probability)
- Market continues in a rising channel
- Pullbacks remain buying opportunities rather than trend reversals
- Gradual upward expansion with rotational leadership
Bullish Extension Scenario
- Sustained acceptance above recent highs
- Momentum expansion resumes
- Index targets higher value zones without major drawdowns
Risk Scenario (Lower Probability)
- Breakdown below primary trend support
- Would signal a medium-term corrective phase, not a secular bear market
- At present, no evidence supports this scenario
7. Strategic Interpretation for Investors
- The market is not overextended despite being near highs
- This is a trend-following environment, not a mean-reversion one
- Strategy should focus on:
- Staying aligned with the primary trend
- Avoiding over-leveraged counter-trend positions
- Using structural pullbacks for exposure rather than chasing breakouts
8. Conclusion
From 01 April 2025 to now, NIFTY 50 has evolved into a mature, institutionally supported uptrend. The index has demonstrated:
- Strong structural resilience
- Clean momentum cycles
- Disciplined volatility behavior
The current market phase favors patience, trend alignment, and risk-managed participation, rather than aggressive short-term speculation.
Unless structural supports are decisively violated, the long-term outlook remains constructively bullish.